

Key Takeaways
What a BMI Chart Actually Shows
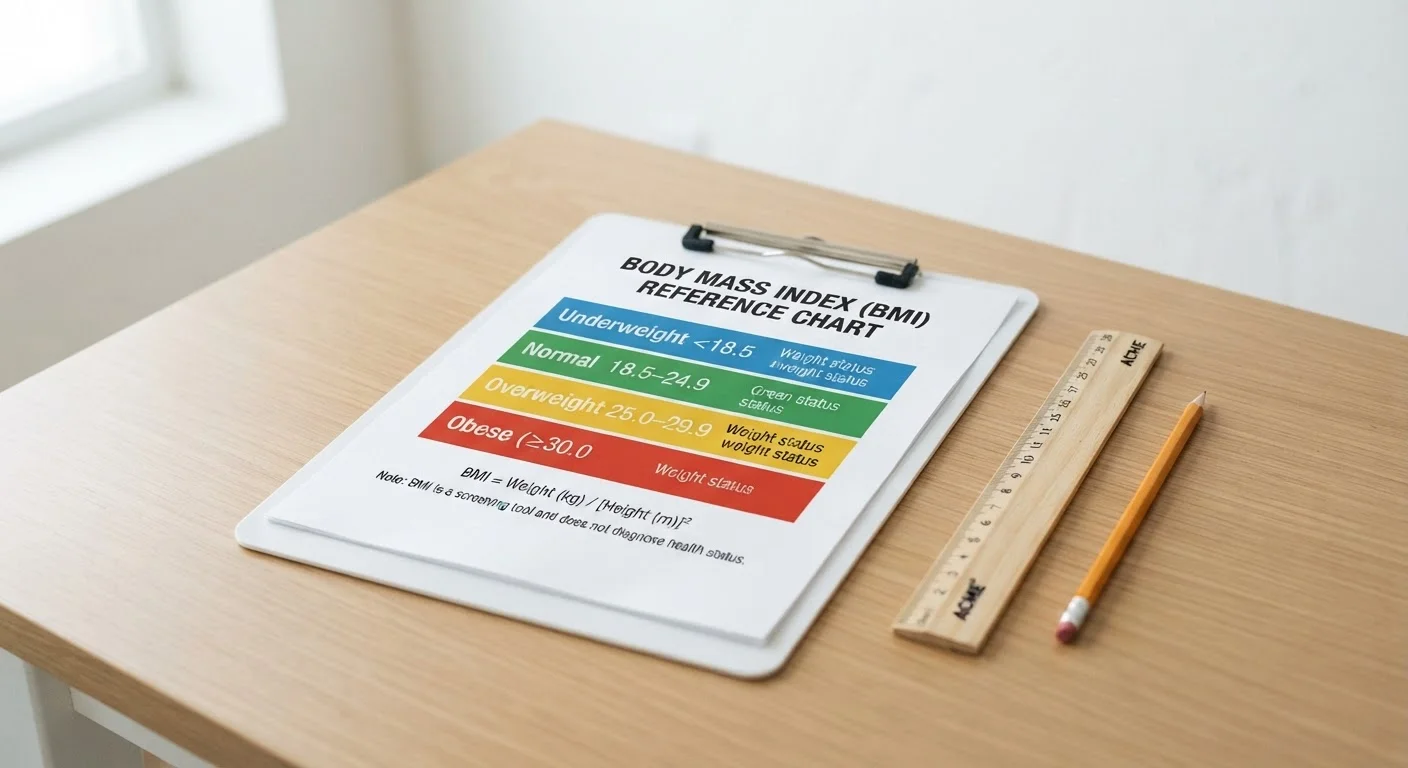
Body Mass Index (BMI) is a numerical value derived from a straightforward formula: weight in kilograms divided by height in meters squared (kg/m²). The resulting number is then compared against four standard categories established by the World Health Organization and used widely in clinical and public health contexts:
- Underweight: Below 18.5
- Normal weight: 18.5-24.9
- Overweight: 25-29.9
- Obesity: 30 and above
These thresholds were set based on associations observed across large population studies - meaning they reflect statistical correlations between weight-to-height ratios and health outcomes at a group level. They were not designed to evaluate any single individual's health status.
It is also worth understanding the historical context: BMI was developed in the 19th century by the Belgian mathematician Adolphe Quetelet as a tool for studying populations, not patients. Modern research has confirmed its usefulness as a rough screening signal while also cataloguing its limitations. For a side-by-side look at how BMI compares with other body composition measures, see BMI, Body Fat Percentage, and Waist Circumference: What Each One Tells You.
How to Read Your BMI Result
What you will need
Follow these steps to find and interpret your BMI number accurately - and to avoid common misreadings.
Calculate your BMI
Use a reliable BMI calculator from a public health source (such as the CDC or NIH websites) or apply the formula directly. In metric units: divide your weight in kilograms by your height in meters squared. In imperial units: divide your weight in pounds by your height in inches squared, then multiply by 703. Double-check your inputs - even small errors in height can shift the result meaningfully.
Locate your number on the chart
Find where your result falls within the four standard adult categories: underweight (below 18.5), normal weight (18.5-24.9), overweight (25-29.9), or obesity (30 and above). Note that these thresholds apply to adults aged 20 and older; separate age- and sex-specific charts are used for children and teenagers.
Read the category as a signal, not a verdict
Acknowledge which category your BMI falls into without treating that label as a diagnosis. The category reflects where your weight-to-height ratio sits relative to population-based statistical thresholds - it is a starting point for conversation, not a conclusion about your individual health.
Check whether adjusted thresholds apply to you
If you are of Asian descent, some health organizations recommend evaluating risk at BMI cutoffs roughly 2-3 points lower than the standard thresholds. Ask a healthcare provider whether population-specific reference ranges are relevant to your background and health history.
Consider additional context before drawing conclusions
Reflect on factors that BMI does not capture: your body composition (lean mass versus fat mass), where your body tends to store fat, your fitness level, your family health history, and relevant lifestyle factors. These dimensions collectively matter more to your health picture than any single numeric category.
Understanding the Documented Limitations
Reading a BMI chart responsibly means knowing what the number cannot tell you. Several well-documented limitations are worth keeping in mind:
- It does not measure body fat: Two people with identical BMIs can have vastly different proportions of fat mass and lean mass. A person with high muscle mass may register as "overweight" despite having a low percentage of body fat.
- It ignores fat distribution: Where body fat is stored - particularly around the abdomen versus the hips and thighs - is clinically meaningful, and BMI captures none of this.
- Ethnic and racial variation matters: The standard BMI cutoffs were derived largely from data on white European populations. Research suggests that people of Asian descent may face elevated health risks at lower BMI values, while the same thresholds may not apply equally across other ethnic groups. Some health organizations publish adjusted reference ranges for specific populations.
- It does not account for age or sex: Body composition changes across the lifespan, and differences in typical fat distribution between sexes are not reflected in the standard adult chart.
These are not fringe critiques - they are acknowledged by major health agencies, including the CDC and the WHO. For a broader look at commonly misunderstood weight-health relationships, see Common Misconceptions About Weight and Health, Examined.
BMI Is Not a Medical Diagnosis
A BMI number alone cannot tell you whether you are healthy, at risk for disease, or in need of treatment. It is a population-level screening statistic, not a clinical verdict. If you have concerns about your weight or health, a qualified healthcare provider can evaluate the full picture with appropriate tests and context.
Putting BMI in Its Proper Place
BMI is best understood as one data point among several - a low-cost, population-level screening signal that prompts further evaluation rather than arriving at conclusions on its own. Clinicians commonly pair BMI with waist circumference measurements, blood pressure, fasting glucose, lipid panels, and a review of lifestyle factors before forming any clinical assessment.
If your BMI falls outside the "normal" range in either direction, that is a reasonable conversation to have with a healthcare provider - not a cause for alarm or shame. Likewise, a BMI that falls within the "normal" range does not guarantee the absence of metabolic or cardiovascular risk. Health is multidimensional, and no single number captures it fully.
For a concise overview of BMI alongside other common weight-related metrics and their reference ranges, Body Weight Metrics at a Glance: A Reference Guide offers a useful companion resource.
This article is for general informational purposes only and is not a substitute for personalized medical advice. Consult a qualified healthcare professional for guidance specific to your health circumstances.